DIY DNS client stats collection (part 2)

In this second part, I offer another solution for collecting DNS client query statistics on the fly using commercial off-the-shelf tools that will provide a bit more flexibility.
OVERVIEW
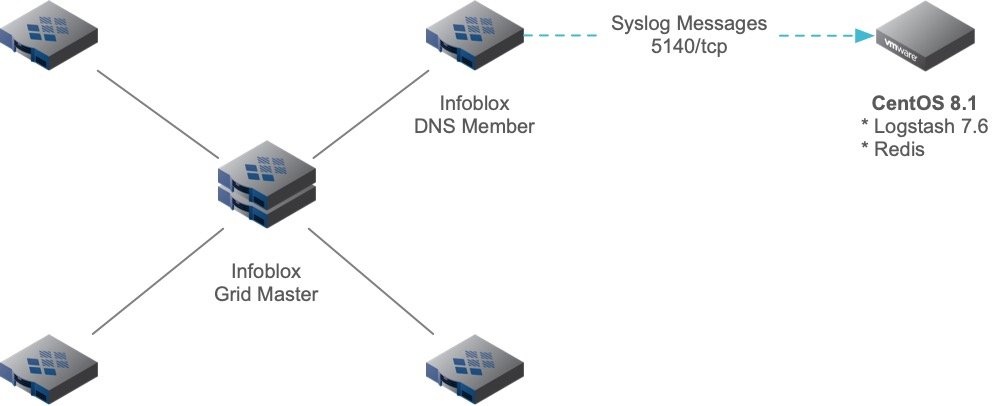
In this blog article, I explore a different way of gathering and reporting DNS Client Resolver statistics. In this post, I use a combination of Open Source Software and commercial off-the-shelf software in rolling a solution to build a list of DNS Top Talkers. In this second part, we continue to rely on DNS query logging, but instead of harvesting log data by downloading and parsing through Infoblox Support Bundles, we'll set up a remote Linux system to capture logged events, and perform query counts. Any other message that does not meet our criteria will simply be discarded. DNS Query Logging is enabled on a single Infoblox DNS Grid Member. In addition, we configure the Grid to send syslog messages to a remote logging destination as well.
This article applies to the following:
- Infoblox NIOS 6.12.x and above
- RHEL/CentOS 8.x
- Java 11
- Logstash v7.6
- Redis 5.0.3.1
The Problem
The problem is the same as before - We want to quickly, easily, and efficiently enumerate all the DNS clients by IP address that are "hitting" a particular Infoblox DNS Grid Member. From that data, we'll build a DNS Top Talkers list. The main difference in this solution is that we will create a counter mechanism that will offer greater flexibility:
- ability to reset counters - with this solution, we can reset ALL counters
- ability to start/stop counts over a particular interval - we can now focus our counts for a particular interval such as 0900 till 1400 using the aforementioned reset capability
- no need to pull large support bundles - this mechanism consumes remote syslog messages instead of parsing logs from support bundles
- much simpler to operate - there are fewer commands, issues, etc. to perform since this is a consumer of a data feed
- improved persistence mechanism - data is persisted as long as you wish in Redis, a key/value data store server application
- impervious to rolled logs - this method circumvents the problem of rolled log files, since we are using a live data stream of syslog messages. This means we can collect stats over a much longer period without issue.
The Resolution
As we already mentioned, we solve the problem a bit differently. Not only do we rely on enabling DNS Query Logging, but we configure the Infoblox Grid DNS Member to send remote Syslog messages to a Linux DNS statistics collection virtual machine or VM. At a high level, our solution looks like the following:
Caveat Emptor (Buyer Beware) - Enabling DNS query logging puts significant I/O overhead on the name server, reducing it's performance as a result. Do this with caution! Check the resources of the server, evaluate risk, and proceed with caution.
Once again, since the server in question had to be removed from the network, we accepted the above risk associated with running Query Logging on the impacted Grid DNS Member. You can run this solution as long as you need to without having to worry about rolling log files or having to collect Infoblox Support Bundles from the Grid DNS Member.
Our Tasks
The following is a list of tasks needed to carry out this recipe for DNS statistics collection:
- Perform a "minimal install" of RHEL/CentOS 8.1 on a VM
- Install Java 11
- Install Logstash
- Install Redis
- Configure Logstash
- Add firewall rules
- Configure Remote Syslog messages to VM
INFO - in this solution, I used a 4x4x18 VM which consisted of four (4) vCPUs, 4G RAM, and an 18G Disk. I performed a "minimal install" of CentOS 8.1 and disabled SELinux.
Install Java 11
You MUST install Java 11 to support the latest version of Logstash v7.6 (at the time of this article)
yum install java-11-openjdk -y
Install Logstash
Logstash is part of the Elasticsearch Logging Stack or ELK. You can get more information on Logstash from https://www.elastic.co/
First, you need to add the Yum Repo. Do this by creating a file named /etc/yum.repos.d/logstash.repo with the following content:
[logstash-7.x]
name=Elastic repository for 7.x packages
baseurl=https://artifacts.elastic.co/packages/7.x/yum
gpgcheck=1
gpgkey=https://artifacts.elastic.co/GPG-KEY-elasticsearch
enabled=1
autorefresh=1
type=rpm-md
Once created, install the rpm package:
yum install logstash -y
Install Redis
Redis is a great many different things, but we'll use it in our solution as a light-weight Key/Value pair database. Learn more about Redis at https://redis.io/. Install Redis as follows:
yum install redis -y
Once installed, we should start and enable Redis to run via systemd. Do this as follows:
systemctl enable redis
systemctl start redis
Simple as that!
Configuring Logstash
So, we've installed Logstash 7.6, but we haven't configured it. To configure Logstash, we will need to create our configuration in the /etc/logstash/conf.d directory. We'll start by creating a file called syslog-pipeline.conf. A Logstash configuration consists of inputs, outputs and, in our case, a filter.
Start by creating our inputs as follows:
input {
  tcp {
    port => 5140
    type => syslog
  }
  udp {
    port => 5140
    type => syslog
  }
}
The above inputs, creates a "listener" on tcp and udp port 5140 for syslog messages. I chose port 5140 so that it was > 1024, which permits us to run this as a non-root user. Otherwise, we'd have to run it as a root-owned process if we used the standard port 514 which is less than 1024.
Configure the outputs as follows:
output {
  exec {
    command => "redis-cli INCR %{dns_src_ip}"
  }
  file {
    path => "/var/log/logstash/logstash.log"
  }
}
The above output block has two (2) outputs:
- exec - this executes a shell command
- file - this writes data out to a file
The exec command will call the redis-cli command and pass it the INCR or increment command to the following key variable dns_src_ip. For each different IP address that is passed by this variable, a counter is incremented in redis. So, where does our variable %{dns_src_ip} come from? It comes from a filter that we'll add to our Logstash config.
Add the following filter block to capture all DNS Query Logging messages which extracts the DNS source IP to the variable dns_src_ip:
filter {
  if [type] == "syslog" and [message] =~ /named.*query:/ {
    grok {
      match => {
        "message" => "<%{POSINT:priority}>%{SYSLOGTIMESTAMP:syslog_timestamp} %{SYSLOGHOST:syslog_hostname} %{DATA:syslog_program}(?:\[%{POSINT:syslog_pid}\])?: client @[0-9a-z]+ %{IP:dns_src_ip}#[0-9]+ %{GREEDYDATA:syslog_message}"
      }
    }
  }
  else {
    drop { }
  }
}
This filter grabs all messages from the named process that include the text query: in them. We create a match using the grok plugin filter which further parses our Syslog message in to fields. One of the fields we grab and set is the DNS Client IP Address and we set that to a variable called dns_src_ip.
The only other thing left is to start and enable the Logstash process. Now that we've created our /etc/logstash/conf.d/syslog-pipeline.conf file, we can start and enable Logstash using systemd:
systemctl enable logstash
systemctl start logstash
INFO - to troubleshoot startup or other run-time problems with Logstash, check the log files in /var/log/logstash/*
Configure the Firewall Rules
Ok - we have Redis up and running and Logstash is configured and running. What happens if we start to send messages from the Grid to either UDP or TCP port 5140? They will get rejected. We have a local firewall running on our CentOS 8.x instance. Let's make sure we open those port(s). Do this as follows:
firewall-cmd --permanent --add-port 5140/tcp
firewall-cmd --permanent --add-port 5140/udp
firewall-cmd --reload
We should be good to go now.
Configure Remote Syslog
On the Infoblox Grid, configure remote Sysloging to our CentOS VM by editing the Monitoring properties of the specific Grid Member in Grid > Members > select the Grid DNS member in question and edit the properties. On the Monitoring Properties, you can add Remote Syslog Properties. See the figure below:

Upon saving that configuration, you'll be required to restart Infoblox Services on that Member, accept the default and click "Yes" on the dialog box that appears.
How to operate our collector
At this point, we've completed all the installation and configuration steps required to collect DNS statistics on our Stats Collector VM. To view stats, you can use the redis-cli to list the KEYS in the Redis collection:
Example:
redis-cli KEYS *
1) "192.168.40.108"
2) "192.168.90.112"
3) "192.168.40.117"
This shows we've collected stats from these three (3) DNS clients. To see the qcount for each IP, you can type the following:
[root@centos8-logstash01 ~]# redis-cli GET "192.168.40.108"
"2"
[root@centos8-logstash01 ~]# redis-cli GET "192.168.90.112"
"18"
[root@centos8-logstash01 ~]# redis-cli GET "192.168.40.117"
"1"
While it is somewhat cumbersome to use the redis-cli command, you can rely on scripts and other tools to fetch, extract, sort, and parse the data. Using Python3 and the redis module, you can easily fetch the stats and parse into a CSV as shown below:
#!/usr/bin/env python3

import redis

r = redis.Redis(host='127.0.0.1', port=6379, db=0)
dns_client_ips = r.keys()

for dns_client_ip in dns_client_ips:
    qcount = r.get(dns_client_ip)
    print(f'{dns_client_ip},{qcount}')
This simple script would produce the following output:
b'192.168.40.108',b'2'
b'192.168.90.112',b'18'
b'192.168.40.117',b'1'
Should we need to reset our collection database, we can issue the following:
redis-cli FLUSHALL
OK
Warning - this will flush ALL keys and values from the database. EVERYTHING!
redis-cli KEYS *
(empty list or set)
See? All gone. Our counter(s) have been reset. We could allow this to run over some interval and re-fetch the stats at a later time to see what the qcount has been over an hour, day, week or month for example.
I hope this provides some additional inspiration the next time you need a quick way of collecting DNS client resolver stats on a server you need to decommission. Till next time...